For languages other than English, use the Google Translate tool at the bottom of this page.
Redesigning a bus network is a collaborative planning effort to determine where today's bus service should go. A bus network redesign includes changes to the routes, frequencies, and spans of service, in a way that dynamically responds and adapts to the needs and travel patterns of customers and reallocates available resources where they will have the greatest impact.
Bus network redesign timeline
- Project launch
- Data analysis and public outreach
- Redraw network and develop Draft Plan
- Draft Plan public outreach
- Develop Proposed Final Plan
- Proposed Final Plan public outreach
- Public hearing
- Proposed Final Plan addendum
- Board vote
- Implementation preparation
- Project implemented
Tradeoffs in bus network redesigns
Due to operating resource constraints, transit agencies and the public must choose how best to create the network they want. Working together to determine the answers to questions like the ones posed below, transit agencies and the public can prioritize certain features over others and allocate resources accordingly.
Here are some of the examples of tradeoffs cities and communities make during the redesign process:
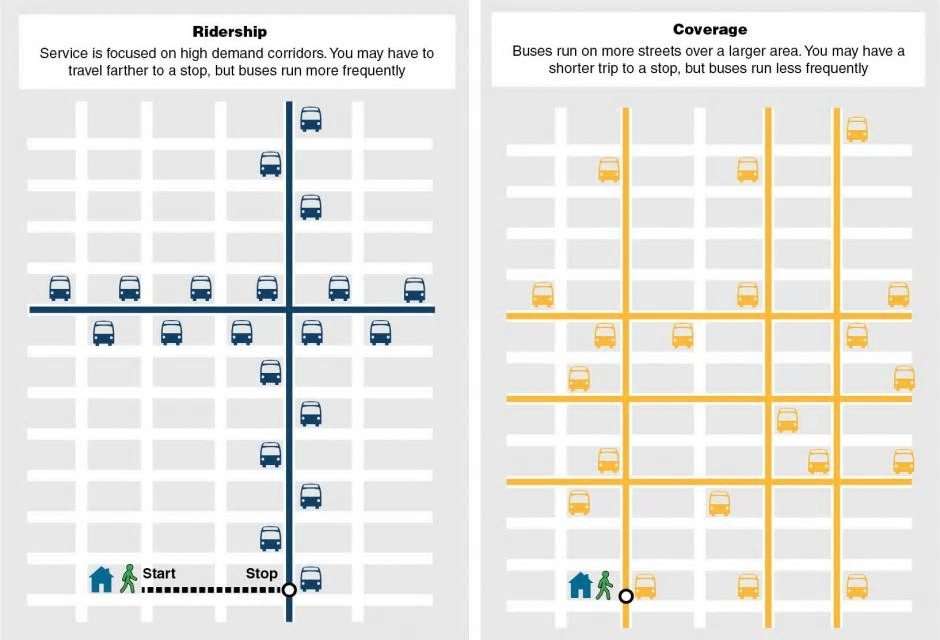
- Ridership versus coverage
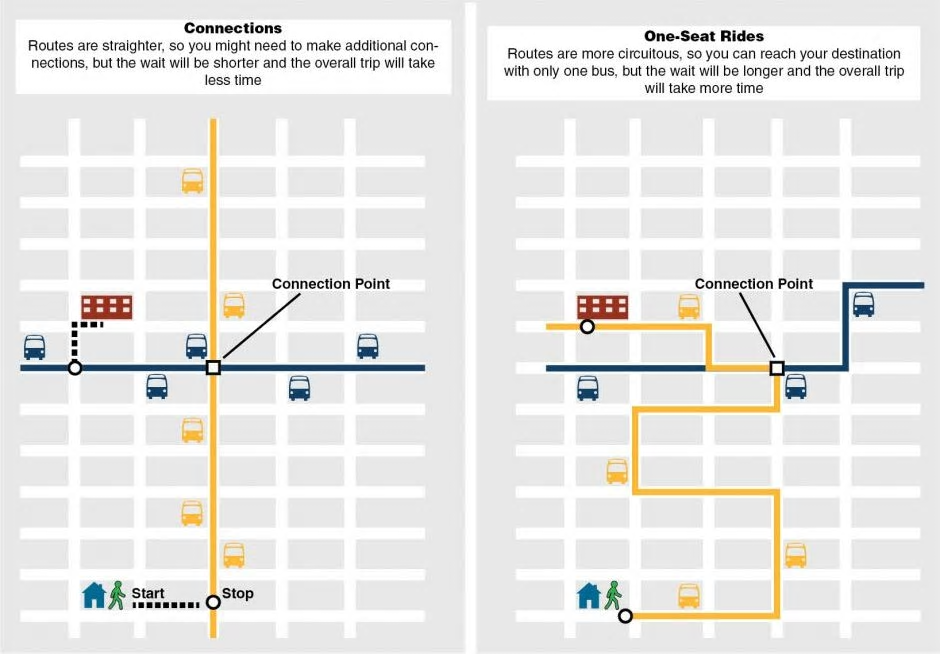
- Connections versus one-seat rides
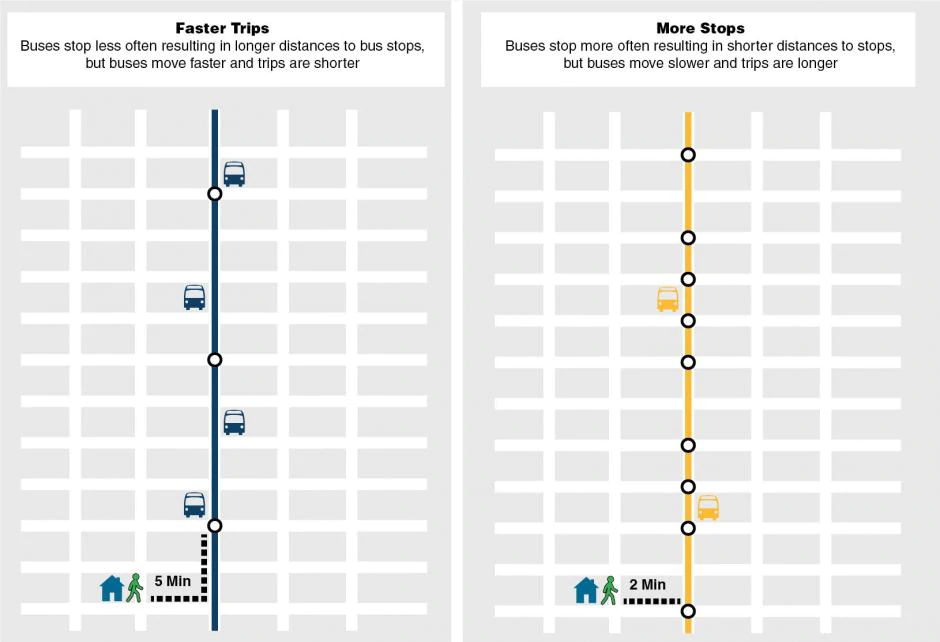
- Faster trips versus more stops
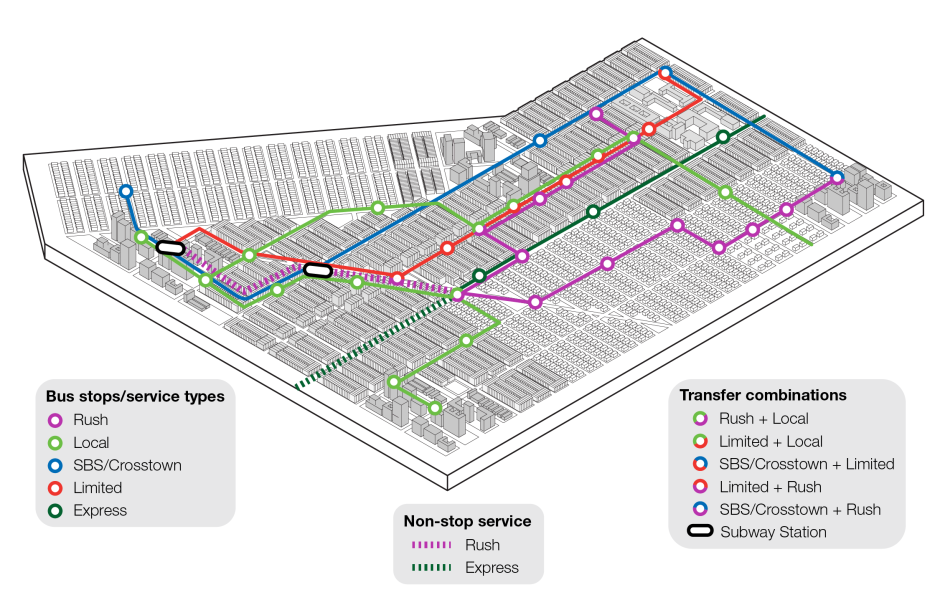
The MTA’s bus route types
The MTA’s fully redesigned bus network will consist of the following five route classifications. These route types are designed to interact as one network to provide broad connectivity within and between neighborhoods across the city, serving the diverse transportation needs of the city’s residents, workers, and visitors.
Local
- Stops spaced approximately 1/4 mile apart
- Frequencies based on demand in the areas they serve
- Connects between neighborhoods, transit hubs, and key destinations
Average bus stop spacing: 1,000–1,320 feet (1/4 mile)
Limited
- Average stop spacing of 1/3 mile and frequent all-day service
- Stops located at high ridership locations or key transfer points and destinations
- Combine with SBS routes to form a high-frequency core network
- These routes serve high-ridership, high-density areas
Average bus stop spacing: 1,760 feet (1/3 mile)
Rush
- Stop spacing pattern to consist of local and limited zones
- Average stop spacing for local is approximately 1/4 mile; limited is 1/3 mile with stops at key transfer points and destinations
- More frequent in AM/PM peak periods
- Quickly connects outer-borough neighborhoods to the subway
Average bus stop spacing: 1/4 mile in local zone, 1/3 mile in limited zone
Select Bus Service (SBS)/Crosstown
- Wide stop spacing and frequent all-day service
- Have busways or bus lanes on a significant portion of their route length
- Bus stops with amenities
- Combine with Limited routes to form a high-frequency core network
- These routes serve high-ridership, high-density areas
Average bus stop spacing: 2,640 feet (1/2 mile)
Express
- Connects neighborhoods in the outer boroughs to the Central Business District of Manhattan
- Charge premium fare
- Long non-stop portion along high-speed corridor
- More frequent in AM/PM peak periods with little off-peak/weekend service
Average bus stop spacing: 1,760 feet (1/3 mile), excluding non-stop portion
Distance between bus stops for each route type
While it may be convenient to have a bus stop right outside your door, too many bus stops too close together dramatically slow down the bus and worsen reliability. Each time the bus stops, it must exit traffic, load and unload passengers, and wait to reenter traffic, resulting in decreased speed and increased travel times. The waiting time for a bus to re-enter traffic can range from 20 seconds during off-peak travel times to more than one minute during peak rush hour. By maintaining appropriate spacing between bus stops, we can keep buses moving with the flow of traffic and get riders where they need to go more quickly.
The following is typical bus stop spacing for each of our five route types. Each distance refers to the average stop spacing for an entire route (or, for Rush routes, a section of a route). Note that based on local conditions – including ridership, land use, and block length – some route averages will fall below the typical stop spacing and some route averages will fall above.
-
Local routes: Average stop spacing of approximately 1,000–1,320 feet between stops. The distance between consecutive stops should generally not be less than 750 feet or exceed 1,500 feet.
Consecutive stops may exceed 1,500 feet if an intermediate stop cannot be added because:
- The surrounding land use makes adding a stop infeasible (e.g. large parks, bridges, tunnels, busy or extensive driveways).
- A bus stop location would create operational challenges for a turn on the route.
- There is no crosswalk for pedestrian safety.
- A bus stop in the route’s opposite direction is infeasible, as stop pairs are preferred for customer convenience and system legibility.
- Limited routes: Average stop spacing of approximately 1,760 feet (1/3 mile) between stops. Stops should be located primarily at high ridership locations or key transfer points and destinations to ensure faster travel.
- Rush routes: Local zone should follow the local route guidelines. The limited zone should have an average stop spacing of approximately 1,760 feet (1/3 mile), with stops located only at key transfer points and destinations to ensure faster travel.
- Select Bus Service (SBS)/Crosstown routes: Average stop spacing of approximately 2,640 feet (1/2 mile) between stops. Stops should be located primarily at high ridership locations or key transfer points and destinations to ensure faster travel. Some SBS routes without an underlying Local route have closer average stop spacing.
- Express routes: average stop spacing of approximately 1,760 feet (1/3 mile) between stops, excluding non-stop segments.
For all route types, the distance between consecutive stops should not be less than 750 feet unless one or both closely spaced stops are:
- Transfer points.
- Adjacent to key destinations such as schools, hospitals, or senior centers.
- On a hill or other difficult terrain/land use.
- In areas with a high concentration of seniors (75+) or people with disabilities.
Note that from 10pm to 5am, customers can ask their bus operator to let them off at locations that aren’t bus stops on local and express routes.